Changing forests, Changing climate and Changing economies
One of the fascinating aspects of working with data in clean technology is how variable the data are over space and time. So, as scientists trying to understand how different systems interact with each other, it usually means that we’re building several models that work together so that both the spatial and temporal aspects are accounted for.
And that’s especially true in the forestry sector. Forests are incredibly important ecosystems - untouched forests in the Amazon, Indonesia, the Congo Basin and other areas sequester carbon, provide habitat for species that cannot be found elsewhere and have been found to be important controllers of weather patterns locally and regionally. Additionally, second growth forests and agro-forests supply timber, medicines and other products that contribute close to $583 billion dollars every year to the global economy.
Further, as countries around the globe work on combating climate change, REDD+ payments or payments to developing countries for reducing emissions through reducing forest degradation become an important income source for communities. These payments help transform local economies from extracting resources from the forests to protecting these ecosystems.
However, one of the biggest challenges in making this transformation is the difficulty in monitoring the rate of degradation in these remote and difficult to access ecosystems. How then can we figure out what is happening in the forests around the world?
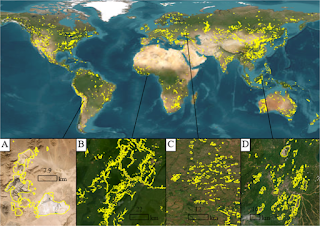
A common solution is to use remote sensing data from satellites combined with models of forest behavior to understand how the ecosystems are changing in quality and extent. In other words, can we use satellite data to figure out when valuable untouched forests have been burned to create second-growth ecosystems or how much forest land is being lost to other activities?
Scientists from Boston University developed an interesting technique that combined time series analysis, classification algorithms and forest models in order to answer that very question - how much forest has been lost, what’s the rate of the change and what has the forest land been transformed to?
Now, typically, the rate and extent of land-use change can be mapped from remote sensing data using image-processing techniques that are based on change detection or classification. To quote the scientists - “Change detection is possible because changes in land surface conditions alter the spectral signature measured by the satellite, but the subtle and spatially-isolated nature of degradation makes remote sensing of forest degradation difficult. Additionally, some of the disturbances are located at spatial scales that are smaller than the pixel resolution of the satellites - which makes it nearly impossible to detect”.
What the researchers did was to develop a model based on their understanding of forest processes called the Normalized Degradation Forest Index (NDFI) that could determine whether the forest was cleared, logged or undisturbed on a pixel-by-pixel basis. The NDFI is a function of soil, shade,green vegetation (GV), and non-photosynthetic vegetation (NPV). They then combined that model with a time-series model and a random forests classifier in order to predict the area, rate and extent of forests being cleared or transformed. Since the model runs continuously over the entire time period being evaluated, multiple degradation and deforestation events could be detected in remote regions of the Amazon forests. This meant that the accuracy of identifying and predicting the extent and rate of deforestation was greatly increased - which in practical terms means better validation for making payments based on the REDD+ scheme.
This is just an example of how spatial and temporal data are combined in clean technology - and how models need to be built that account for that. In fact, time series analysis is such an important facet of all problems in clean technology - whether it’s predicting flooding events, energy use or climate change - that graduate programs in universities often devote several classes to helping students master these skills.