Building Models With Missing Data
Have you ever worked with a real-world problem where you have all the data that you need in a form that you could easily use to build models?
In the case of most problems, we find that data are missing, or there are errors in how the data are measured, or we’re faced with different types of data that need to be integrated. That’s been especially true in many clean technology fields - water, energy, climate, sustainability, ecosystem restoration and agriculture among them.
So, how do we deal with data with so many challenges?
One way is to see if there are alternative ways of measuring the data. One possibility is to identify surrogate datasets that can be calibrated and used as alternatives for the primary measurement. A second possibility is using cheaper, more widely distributed sensor data such as Purple Air sensors for air quality monitoring in combination with the primary data sources so that models can be developed. A third alternative is to use modeling techniques like Bayesian networks that can accommodate missing data points by incorporating them into estimates of how much the missing data contributes to uncertainty in the model predictions.
The first method was used by scientists at the University of Illinois, Urbana-Champaign in order to estimate how much corn and soybean were planted in an area in Illinois. Normally, it takes 4-6 months after the crops are harvested for the US Department of Agriculture to provide estimates of the number of acres that were planted by corn and soybean. This means that decisions about policies on conservation, agricultural aid and so on are made using state estimates that have greater uncertainty in their values. Similarly with pricing and managing agricultural futures in the markets. So any method that can provide quicker, more accurate estimates is extremely valuable from an economic and policy standpoint.
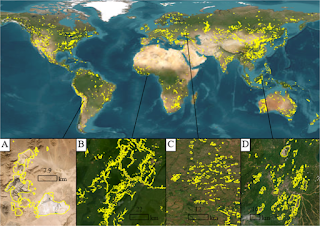
However, the challenge in this is that it’s difficult to distinguish between corn and soybean using standard remote sensing data. Remote sensing data or data collected by satellites from space, is collected from a range of wavelengths. The wavelengths that are usually used in estimating crops and crop acreage belong to the visible spectrum - the RGB wavelengths. In addition to the difficulty in figuring out which crops are corn and soybean with these data, there are often locations and times when data cannot be collected because of clouds or other issues with the satellite sensors - leading to missing data points.
In order to solve this problem, the researchers discovered that there’s a secondary wavelength that can be even more effective in distinguishing corn and soybean at very early stages in the crop growth. By measuring the short-wave infrared wavelength (SWIR), a clear difference between the corn and soybean plants can be found - because the SWIR wavelength measures the water content in plant leaves, which is very different in corn and soybean plants when they start growing. By building a deep learning neural network to analyze 15 years satellite SWIR data at a 30m resolution, the scientists were able to identify corn and soybean acreage with 95% accuracy by the end of July for each field - just about 2-3 months after planting and well before harvest.
As you see, this is a significant improvement from traditional methods and will aid policy makers, farmers and traders in making decisions and optimizing allocation of resources - which in turn results in economic benefits.
This kind of combination of data sources, machine learning and economic analyses are what make data science in agriculture such an exciting field to be in as far as technical advancement, economic benefits and job creation!