Not just another machine learning algorithm - how solving clean technology applications forces adaptations in basic machine learning techniques.
One of the first questions I get about workshops on this topic is - why do we need to talk about machine learning again? There are tons of online courses available already, lots of free material on the web and libraries in Python that are easy enough to get started with. So, why look at this stuff once more? Why not just point us to the best existing resources and let us get on with it?
And the answer is - yes, there are lots of excellent resources (free and paid) on machine learning and yes, we’ll have a list of those resources available for additional reference. But, and this is a big but - many of these resources are targeted to problems faced in the high-tech sector, where the data and types of problems are very different. When we’re solving problems in clean technology, the kind of data we have and the questions we’re faced with are often quite different. That means that machine learning algorithms have to be adapted to work in our sector - and the way they get adapted is a function of the problem we’re working on.
As an example of how this works, let’s take a look at some of the latest research that has come out of academia on building land use and land cover models.
Land use/Land cover models are a way by which we can monitor what is happening in a specific part of the Earth - how human activity is changing natural ecosystems, what the extent of existing natural systems are and any potential impacts. Why is that important? Because by identifying these changes and impacts, we can build policies that help different communities, identify where gaps in existing data and policies are, build better disaster management response systems - a whole suite of things.
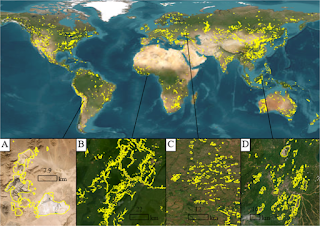
How that’s done is by monitoring satellite data - i.e. we look at images from satellites, identify what is forest/agricultural land/cities/water bodies and see how things have changed compared to previous data. Sounds pretty straightforward, right?
The catch is that you have to be able to identify all these different categories of land and ecosystems with sufficient accuracy and you have to be able to link it to economic conditions and human behavior. Now, unlike images from Google Search, satellite data on what’s forest or cropland or bare ground is difficult to verify at the ground level. It takes a lot of field work to make that verification - and that’s not always available for all the land use categories in all countries. Additionally, data on how that land has changed is available at a smaller scale - you’re going to see these changes over the course of seasons and years. That means that the validation datasets for your algorithms are small - compared to a large library of images of cats and dogs that have been labeled by people over the years.
So, how exactly are the algorithms built? That’s when we start looking at secondary data, combining different types of models and in general - building a complicated system that incorporates machine learning - but just not in the way it’s traditionally done in high-tech applications.
And that’s what scientists at my alma mater, the University of Illinois, did. They wanted to find out how land use was changing in Bangladesh, where climate change is having quite an impact, but where data on the ground is limited and difficult to obtain. They built a complicated model where they used a classification algorithm (a machine learning algorithm) to identify different types of land use from satellite images, combined it with a local data base of water bodies as a validation data set, then built a specific algorithm to identify hot-spots of economic activity using data from the Bangladesh government to ground-truth their model, used standard statistics models (principal component analysis and logistic regression) to analyze how secondary data sources for biophysical and economic activity were related to primary land use change variables - and then ran the whole algorithm.
Phew - that does sound pretty complicated and a lot of work! But it’s pretty common in many clean technology applications, so if you’re working in the field, that’s the kind of stuff that you’ll be running into.
The results they got from this model helped them identify where climate change was driving significant land use change - about 11% of forest land was converted to cropland, grassland and other uses. Further, they identified where farming practices changed - from rice cultivation to shrimp ponds - with significant impacts on soil fertility as well as dramatic increases (~9%) in water levels in standing water bodies like lakes and reservoirs. That means that as the climate changes, people living in these areas are going to see significant impacts on where they can live as well as the kind of livelihood they can practice. But, from their model, they were also able to highlight policies that could mitigate these impacts.
This is what machine learning does in clean technology - it’s not straightforward, it’s not simple - but the models and tools you can build make a huge impact on the lives of billions of people around the world.