Posts

When Big Data Doesn’t Tell The Whole Story – Megaregions And Commuting
Image
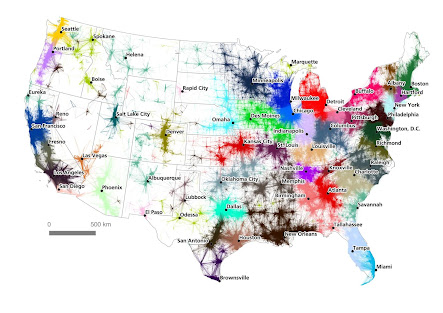
  It’s tempting sometimes to think that we can grab all the lovely data lying around, feed it into a computer algorithm and then get results that magically tell us something new and amazing. That though is the tired data scientist’s fantasy – and thinking about problems that way doesn’t really help solve them! We’re always going to need what’s now being called “domain expertise” in data science circles – that deep understanding of your subject and the expertise that lets you understand when data is valuable, what insights really are insights and when to use the data scientist’s vast array of tools.   A study that was published in   PLOS One   today is a perfect example of how a data scientist typically works through problems in the clean tech space – together with all the associated complications.   The question that was asked in this study was this – “Can I use data about how people commute to understand which regions are economically dominant – that is megaregions?”   So, starting of

Making Clean Tech And Data Science Work: From Micro To Mega…

Image
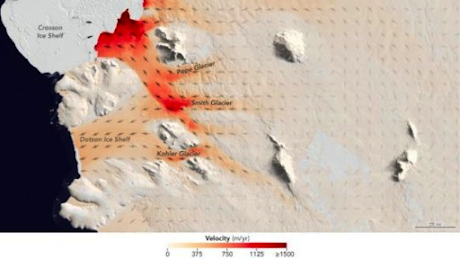
  Several interesting research studies have been written highlighting how data science is being embedded in clean tech. What I find fascinating is that these stories showcase research at very different scales – at the micro level and at the scale of the Earth System. The first study that came out this week was by teams from the University of California, Irvine and NASA’s Jet Propulsion Laboratory evaluating the melting of Antarctica’s glaciers. The teams used satellite data to monitor the location and movement over the years of the glaciers “grounding line” – the point at which the glacier begins to float while still attached to the land. The reason that’s important is because it helps determine how much ice is melting into the oceans – with all the associated implications for understanding sea level rise in a changing climate. The recent data (2014-2016) came from the Sentinel-1 mission launched by the European Space Agency and the previous years data (1992,1996 and 2011) that was use

Water, Water Everywhere – But Where’s The Funding?

  How many times did you think about water this month? If you’re like most people in developed countries, you probably only thought about it when paying your water bill – or if there were news articles about floods or droughts or oceans. If you’re in parts of the world where water is not plentiful, the chances are that you thought about it if you had to plan your day around when water was going to come out of the tap. If, like many of the poor, you had to walk miles or stand in queues to collect drinking water, you probably spent a large part of your day thinking about it. Water is essential to life and yet, we don’t hear a great deal about innovation or venture capital funding or startups that are changing the world in this sector in popular media or news. Which brings up the question – where is the funding for innovation in this sector? Venture capital funding in water is a relatively small investment compared to the investment in high-tech or even in some of the other clean tech sec

Nature’s Supply And Demand Problem

  “Supply and demand” is a phrase that’s more commonly associated with economics and business than with the environment. And yet, when we think about it – Nature provides several services that we take for granted… until they aren’t there anymore. Clean air for example – natural systems have filtered and purified air around cities and homes for many years, until the output from our cities becomes too much for the natural system and then we start noticing the smog and pollution. Or flood control – mangroves in the coastal areas of the tropics provide buffers against storm surges and flooding from hurricanes, until they are cut down for development and then we are faced with multi-million dollar damages from a storm.   Several ecologists and economists have worked together to try and figure out how best to quantify or price the services that natural systems provide, often called ecosystem services. But what happens as the environment changes, the climate warms and several ecosystems are t

Snippets in Clean Technology and Data Science: Urban Sustainability

  Most of us working in the sustainability and clean tech space have heard of “ Smart Cities ” – one of the buzzwords in the clean tech and data science space since 2014. It’s usually used in the context of building better sensors or using artificial intelligence so that certain aspects of living in cities become automated, efficient and   sustainable.   These could be a number of things – better waste management, more efficient lighting, energy efficient buildings across the city, increased green spaces, less water use and so on and so on… As more of the world’s population starts living in cities, it’s critical that we make our cities as livable and sustainable as possible. And that means using all the latest tools at our disposal, especially the new methods by which data are collected and stored in the cloud today. One of the most fascinating aspects of working in the data science space has been the explosion in data that are freely available or available at a relatively low cost as

Snippets in Clean Technology and Data Science: Biomimicry and sustainable materials

  One of the newest entrants in the clean tech arena is the   field of biomimicry and sustainable materials . Research in nanotechnology and biological systems is driving a lot of innovation in how we design materials so that they can be easily recycled/reused or degraded naturally to return to the environment. And not just material design, but also a whole suite of novel solutions to problems that are based on biological systems. First off – designing monitoring systems that can track and monitor wildlife and natural systems .  An interesting interplay between clean technology and data science lies in biomimicry –where natural systems are used as templates for better design. Often, what happens is that there’s an interesting technological advance that is used to collect large amounts of data – and then, researchers figure out by using data science that there is a natural system that could make it even better! A really interesting   invention out of MIT   looks at how robots can be bui

Helping The Environment Recover With Data Science

  After the Deepwater Horizon oil spill, a question that came up frequently was – how long would it be before the environment recovered? This was a concern both for the ocean surrounding the spill area as well as the marshes and beaches inland where the oil washed up. Not all spills are as bad as the Deepwater Horizon one – but a concern that comes up repeatedly when anything needs to be extracted from the Earth is –   what is the impact on the local environment and how long will it take for it to recover or at least return to a state as close to the original one as possible? This is true whether it’s minerals being extracted or gold or oil and natural gas. The recovery of land after oil and gas wells have been drilled is a question that has been studied for quite a while now. In general, most of the work has looked at individual sites and evaluated how they are doing after the extraction is complete and the system has been shut down, but there are very few studies that have been able

Snippets in Clean Technology and Data Science: Wildlife and Ecosystems

  A fun and exciting area to use data science in clean tech is in monitoring wildlife! This sector uses a combination of computer vision, remote sensing, artificial intelligence among other tools to help us track wildlife across the world. Here are a few examples of the kinds of problems and technologies that are in play these days! First, An interesting   study   came out of California recently, where scientists from the University of Delaware, University of California at Davis and the US Geological Survey partnered to track the movement of waterfowl in the region. My first question when I read the study was – why would people, other than wildlife biologists and conservationists, care about what happened to waterfowl? And it turns out that the answer is really important from the perspective of the agricultural industry as well as from a human health perspective. Looking at how close or how far away waterfowl are from poultry farms can help track the spread of avian influenza or “bird

Wildfires, Droughts, Forests and Satellites

  Drought and wildfires always seem to go together! The recent drought in California was accompanied by powerful fires that burnt several million acres of forest, including in the iconic Yosemite National Park.   The question that people often ask whenever there’s news of yet another fire resulting in severe damage to the forests is always –   isn’t there a way to figure out which areas of the forest are most vulnerable to the fires?   And until recently, most rangers and naturalists were estimating that vulnerability based on their experience and years of working in the same forest ecosystem.   Scientists from the University of California, Davis   studied aerial imagery from the forests  in California between the years 2012-2015 to predict the areas where most of the trees were dying, either due to a fire or after a fire had struck. What they found was that the areas that were the worst affected with the highest tree mortality were areas that were both dry and dense. From a commonsens

Snippets in Clean Technology and Data Science: Climate

  Data science has been used extensively in building climate models, downscaling climate models to regions, monitoring and evaluating the accuracy of climate models through  paleoclimate data as well as developing methods to mitigate the effects of climate change and develop alternative markets. Today’s post will look at some of the more straightforward uses of data, machine learning and spatial statistics in monitoring carbon emissions as well as building alternative market systems. The first of course is   monitoring and measuring carbon emissions   and emissions of other gases that contribute to the changing climate. Our first example comes from Europe. Researchers in Europe    created a tool to map the 177 regions in 27 countries of the EU and the carbon footprint associated with them. They used a database (EXIOBASE 2.3 multiregional input-output database) with detailed information about the world economy in 2007 and built a model that looked at the different factors impacting carb

Cooling The City – Green Facades For Mitigating Urban Heat

Anyone who’s ever visited an Indian city in the heat of summer will remember the feeling that the city itself is baking – heat radiates from the pavements, the buildings and there are fewer green areas to mitigate these effects. This is the urban heat island effect – when the city is much hotter than the surrounding areas. Urban heat islands are a common problem and are only going to get worse as the climate warms. This is especially true in countries closer to the equator – summer is hot but is now promising to get even hotter. One of the solutions that people have been looking at is “greening building facades” or more simply – growing plants along the walls of buildings – vertical greening. The advantages of “green building facades” are that the plants help reduce building temperatures through shading by the leaves, reducing the impact of wind and through evapotranspiration. Now, like any other natural system – growing plants vertically means that there are a number of parameters tha

Snippets in Clean Technology and Data Science: Sustainability Accounting

  Let’s take a look at one of the traditional clean tech sectors –   sustainability accounting . Now, this is a term that’s used in many different contexts, but traditionally, it refers to the use and flow of materials and energy. This could be locally, within a company, regionally for a specific sector across countries or monitoring a specific material over the globe. Most large companies these days track their   metrics on sustainability   –   carbon footprint, water usage, waste, conflict minerals   and so on… These metrics and the associated analyses are typically presented in reports that are one-time downloads or available in obscure places on the web. So anyone who’s interested in tracking changes over space and time for a single company or a group of companies – congratulations! You just agreed to spend a huge amount of time trying to get the data before doing anything with it. Enter the company   ESG Trends . This company was started a few years ago and has made it easier to f

Concurrent Air Pollution And Heat Waves Make People Sick

Fact – fifteen of the hottest years have come in the last sixteen years. If you are one of the people who is living through the heat waves and wondering if your asthma is really getting worse or if it’s just your imagination – well congratulations! You’re not alone and you are not imagining things. Scientists at the   University of California, Irvine    wanted to understand what happens to the air pollutants that trigger human health problems like asthma when heat waves occur simultaneously. In other words, if there is already air pollution does having a heat wave at the same time make the pollution worse? And if it does get worse, how badly does it affect people’s health?   In order to answer these questions, they overlaid detailed air pollution maps of the United States and Canada with meterological models and data about heat waves over a 15 year time period. The data was on a very fine 1 degree grid. What they found was that having both a heat wave and existing pollution resulted in

Snippets in Clean Technology and Data Science: Water

  Today, let’s look at some of the ways in which sensors, machine learning and other data science tools are helping solve problems in the water sector Water conservation   is one of the largest components of the water sector. And with the droughts hitting California, New South Wales and South Africa recently, there’s been a lot of focus on education and changing people’s behavior through information.  So how do we make it easy for people to do their best to minimize water use?   Companies and organizations have tried several different approaches – public education programs about water use being one such example. Another being the water comparison report that water companies in California started sending out to their customers with the monthly bill. It’s a short summary that shows how your water usage compares with your neighbors and how much water you have used against your allocation. This is a fairly straightforward use of data science – it uses a nearest neighbor approach with a bui

Snippets in Clean Technology and Data Science: Agriculture and Food

  In today’s post, we’ll take a look at a few problems in Agriculture and Food that are being solved using machine learning, computer vision, social networks and satellite data among other data science tools. What do social networks, sensors, food and farms have in common? Social media immediately makes us think about Facebook, Snapchat, Instagram, Whatsapp, Google and all the different ways in which we human beings connect with each other today. All these apps use Graph and Network Theory to understand how people may be connected to each other, the links between them and how strong or weak those connections are. Reid Hoffman of LinkedIn famously said that “we’re all six weak connections apart from each other” and in today’s connected world, that number looks like it’s getting smaller and smaller. So what would social media have in common with agriculture? First, there’s always the way in which farmers and workers interact and connect with each other.   Several startups like the Farmer